 |
 |
 |
 |
 |
How to read temp trace charts
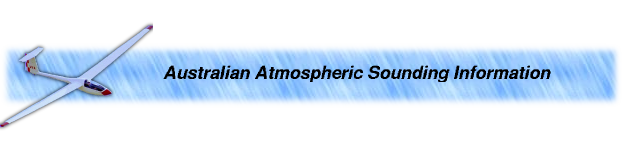
If you've never read temp traces before, the information at this web site could be a little bit daunting. This page is intended to make life a little bit easier for you.We're going to use an extract from a typical trace as our working example below, so have a look at this before we start:
Convection Height
The most common use for this chart is to attempt to estimate the convection height we can expect to see. In other words, we're trying to estimate the height of the thermals.Thermals don't all go to the same height, of course, but by using the data in the temp trace we can get an idea of what kind of day to expect by estimating typical thermals (for some value of "typical").
The first step is to look at the daily weather forecast to find out what the Bureau is saying about the maximum temperature for the day. Thermal height will change as ground temperature varies; by using the daily maximum temperature we'll be able to work out the maximum thermal height. You just need to keep in mind that the maximum temperature is usually only reached for an hour or so on each day; likewise, the convection height we derive will be similarly short-lived.
So, let's say we've looked at the weather report, and it says the maximum temperature for the day is expected to be 21 degrees. Now we can look at our temp trace and see what kind of day that buys us.
What does the temp trace give us? A bit of theory might be useful at this point...
A thermal is a rising parcel of warm air. Describing it like that is actually a bit of a tautology: We know the air is rising because it's warm; In still conditions, a parcel of air which is warmer than its surroundings will always rise.
The key to the convection height calculation is the bit that says, "... warmer than its surroundings...". When the parcel of air is no longer warmer than its surroundings, it will no longer rise.
The temp trace is giving us the temperature of the "surroundings" -- The blue line is a measurement of the ambient air temperature plotted against altitude.
Now, when we say the ground temperature is 21 degrees, what we're really saying is that the air slightly above ground level is 21 degrees.
The other important bit of theory is to do with the physics of gasses: As air rises, its pressure decreases. When the pressure of a gas decreases, its temperature also decreases.
A parcel of air at standard pressure and standard temperature will decrease in temperature by approximately 3 degrees for each 1000' of altitude it ascends, simply due to the pressure change implied by its ascent. This 3 degrees per 1000' change is called the dry-air adiabatic lapse rate
If you look at the temp trace plot, you'll see that the brown diagonal lines are 3 degrees apart, and decreasing at the rate of 3 degrees per 1000' (we call the lines "adiabats"). So if a parcel of air is at, say, the temperature labelled at the bottom of one of those lines when it is at ground level, then its temperature will follow the line as the air ascends. So a 21 degree parcel of ground-level air will have cooled to 18 degrees by the time it rises to 1000'; It'll have reached 15 degrees at 2000', 12 degrees at 3000', etc.
So, we know how the parcel of rising air behaves; The dark blue line on the temp trace tells us about the surrounding air; So we're now in a position to work out when the air will stop rising: it's when the temperature of the parcel of air is the same as its surroundings.
Or, in other words, it's where the brown line crosses the dark blue line.
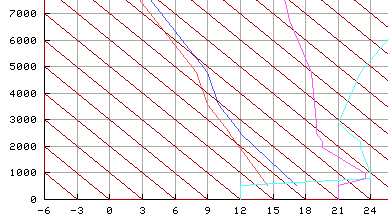
Some diagrams will show what I mean. We've determined (from the forecast) that the day's maximum temperature is going to be 21 degrees. So, start at "21" on the horizontal axis and follow the brown line back and up. Stop when you reach the dark blue line:
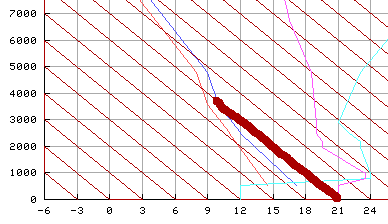
Now read-off the level you've reached against the vertical axis ("height"):
So what this is telling us is that if the temperature on the day reaches 21 degrees, the thermals will reach about 3800'.
That's the maximum thermal height, worked out with the maximum temperature. If you know the temperature at any given point during the day, you can use the temp trace to estimate the current convection height by following the brown line corresponding to the current temperature instead of the maximum temperature.
Temp traces usually have an "inversion" resulting from the cool night-time air hanging around into the day. You can pick an inversion on the temp trace by noting the places where the dark blue line ticks towards the right hand side of the page instead of tending leftwards. If an inversion is present, temperatures during the early part of the day will correspond to severely limited convection heights (i.e., the thermals won't go past the height of the inversion), but when the day warms up enough you'll be able to ignore the inversion and the day will really start cooking. The temperature required to break the inversion is called the trigger temperature
Inversions don't have to be close to the ground. If you look at this trace, you'll see an inversion between 6400' and 7000'. There is hardly any change in thermal height at all between 22 degrees and 32 degrees ground temperature, but very small changes in temperature past 32 degrees result in very large changes in predicted thermal height.
If you can estimate the warming rate, you'll even be able to get an idea of the convection height at various times of the day by looking at the morning temp trace: You'll be able to say, "The inversion will break at 12:30pm, at which point the thermals will go to 5000'. By 3pm they'll be at 8000'. At 6pm the day will be cooling down again, and convection will stop shortly afterwards as we fall into the inversion again." It takes quite a bit of local knowledge to work that kind of thing out, but most clubs have someone nearby who can give you a helping hand.
Working this stuff out can be pretty tedious, so this web site provides a second graph underneath each temp trace, the Predicted Convection Height plot. That's where we've worked out the temperature vs thermal-height calculations for you and plotted them on a graph. When there's an inversion, the trigger temperature will be pretty obvious on the Predicted Convection Height diagram.
Cloudbase
Of course, we can't always soar to the tops of thermals: If cloudbase is below the convection height, that's going to represent a ceiling on our flying.So how do we work out cloudbase? In much the same way as convection. Except we use the dew point instead of the ground temperature, and the wet air adiabatic lapse rate instead of the dry-air adiabatic lapse rate.
You can obtain the dew point from the Bureau of Meteorology's weather pages, but not necessarily for all areas (Adelaide has a Kent Town Daily Weather Summary page which shows the dew point at hourly intervals; Other areas in Australia may have other similar resources.
As a last resort, the red line on the temp trace shows the dew point. Picking somewhere on that line a few hundred feet above the ground (to get away from ground effects) will give an approximation of the dew point of the airmass at the time that the sounding was conducted.
In any case, once you know the dew point, you can follow a a 3 degrees per 3000' line until you reach the blue Temperature line; that should give you the cloudbase. For example, cloudbase on this trace is probably around 10,000 feet (give or take a thousand feet) for a dewpoint temperature of 15 degrees.
The accuracy of your cloudbase approximation will depend on a lot of factors, including the accuracy of your initial dewpoint, and the composition of different layers in the airmass above you. But it should be "close enough".
The wet air adibatic lapse rate is approximately 3 degrees per 3000' (i.e, the adiabats are 3 times steeper than the brown diagonal lines on the plot).
If you work out cloud-base and find that it's below the maximum convection height, Cu will form to mark the thermals for us. If the maximum convection height is below the cloudbase you've worked out, that means the thermal tops aren't cool enough to be below the dew point, so no cloud will form: We'll have a "blue" day.
If you know the warming rate, you can make predictions about when the clouds will form: For example, if you know that cloudbase is at 5000', and that there's an inversion at 3000', you can be pretty sure that the sky will be blue when the inversion breaks, but as the temperature rises during the day and the convection height gets closer to 5000' (cloudbase) you'll be more and more likely to see Cu.
Winds
The temp trace also gives us information about how the winds are behaving with increasing altitude.Where there's a marked difference in wind speed or direction at a given height, we say that there's a wind shear at that height. Wind Shear can make it difficult to follow thermals -- Thermals notionally blow down-wind, and it can be challenging to stay in the core by reference to ground features if the direction implied by "down-wind" varies with height.
You've probably experienced the kind of day when you know the thermals are going to 8000' (because other pilots are up there!) but you can't get about 3000'. That's almost certainly because there's a wind shear at 3000', and you're losing the thermal there while people who understand the wind a bit more adjust their centering technique and keep following the thermal.
Let's look at our example trace again:
The light blue (cyan) line represents wind speed (the numbers on the horizontal axis are interpreted as Knots when you're looking at that line). So at 500' the wind is 12kts, then it abruptly changes to 24kts at about 800', and by the time we're at 3000' it's back down to 21kts.
The magenta line is wind direction -- When you're looking at that line, the numbers on the horizontal axis represent tens of degrees (so "15" is "150 degrees"). If the wind is northerly you sometimes see it jumping all over the plot as it switches from, say, 350 degrees to 10 degrees (example).
It's useful to know about the major changes in wind direction and speed with height. In our example we can see that the wind at 1000' is SW, but it's SSW by 2000', and tending more and more easterly as we get heigher. Thus, as we climbed higher we'd have to keep making north-westerly corrections (if you have a SE wind, you go NW to move down-wind).

